Stock Price Prediction — Stacked LSTM Time-Series Forecasting
Time-series forecasting using historical stock market data and two-layer stacked LSTM networks.
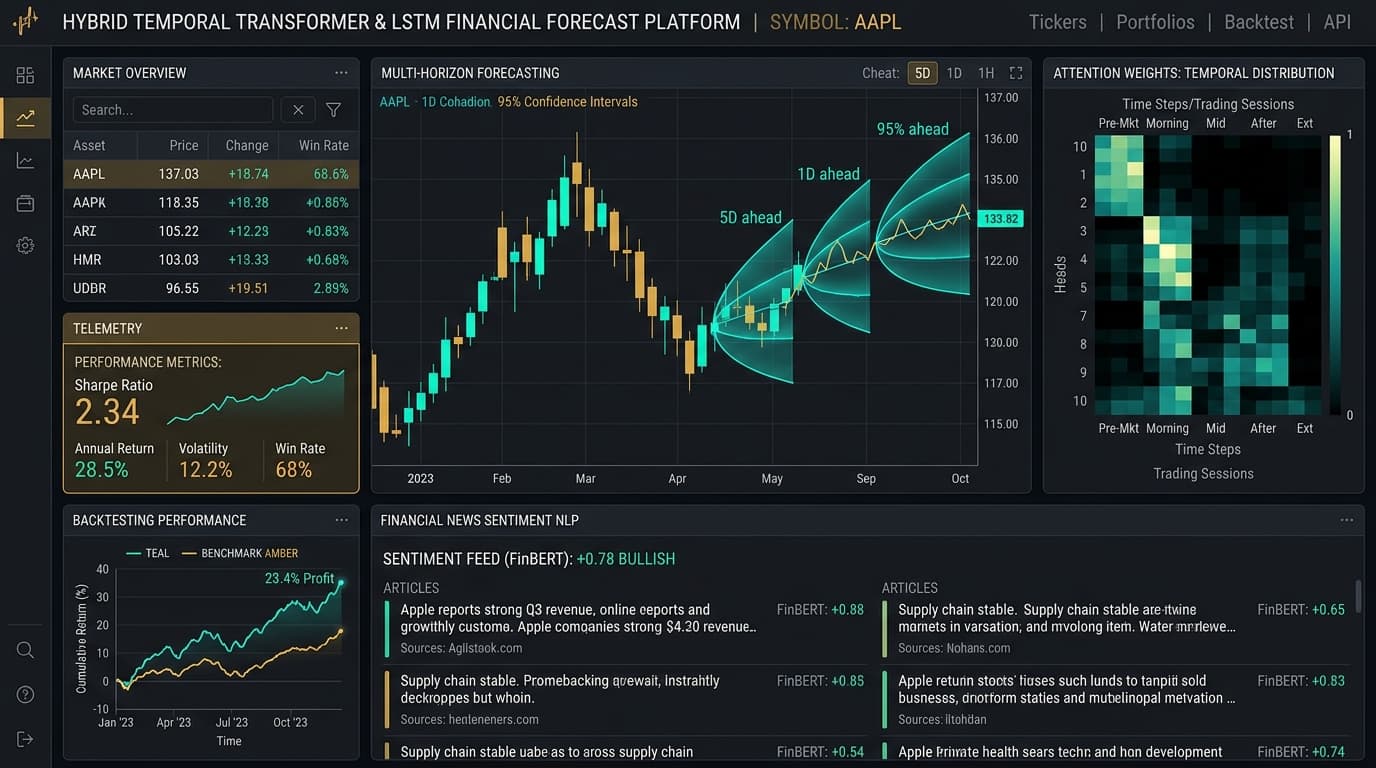
Problem Statement
Financial market series exhibit non-stationary distributions and high noise-to-signal ratios. Standard regression models fail to capture sequential temporal dependencies without experiencing data leakage.
Engineering Goals
- Implement strict chronological train/test splitting to prevent look-ahead bias.
- Design a 2-layer stacked LSTM architecture with dropout to avoid overfitting noisy market fluctuations.
- Achieve low MAPE across top blue-chip securities.
- Deploy a working interactive forecasting interface.
Execution Pipeline & Mechanics
Data Ingestion & Cleaning
Fetches historical adjusted close prices, handling missing trading days and splits.
Feature Engineering & Scaling
Computes exponential moving averages and normalizes data to [0, 1] range.
Sliding Window Transformation
Constructs 60-day historical feature matrices to predict day t+1.
Stacked LSTM Training
Trains 2-layer LSTM with 50 units each and 0.2 dropout, optimizing Adam with MSE loss.
Engineering Challenges & Design Decisions
Decision: Stacked LSTM over standard feed-forward networks
Rationale: Recurrent LSTM gates preserve sequential dependency over rolling time windows far better than vanilla MLPs.
Alternative Rejected: Simple linear regression or shallow multi-layer perceptron.
Core Architectural Highlights
Data is ingested, normalized via MinMaxScaler, transformed into rolling 60-day sequence windows, and passed through stacked LSTM layers with dropout. Predictions are denormalized and visualized against actual market prices.
Testing & Empirical Evaluation
Backtested across historical blue-chip market cycles with out-of-sample test splits.
Security & Reliability Defenses
Key Engineering Learnings
- •Preventing lookahead bias requires normalizing the test partition strictly using parameters derived from the training partition.